Calculate linear principal component analysis (PCA) with a projection method for Single-nucleotide polymorphism (SNP) dataset.
Source:R/principal.component.R
cal.pc.projection.RdIn order to perform the projection method, disease status for all individuals are required. First, PCA is performed only in control group, then project the scores from control group into case group.
cal.pc.projection(
  X,
  status,
  individual_id = NULL,
  labels = NULL,
  no.pc = NA,
  data.type = "linear"
)
Arguments
- X
A data matrix which rows represent samples and columns represent features.
- status
A vector of numbers that contains disease status for all individuals. For control group, the status is "1", and "2" for case group. Individuals with unknown status (other numbers) are ignored and excluded from the result.
- individual_id
A vector of charactors that contains individuals IDs
- labels
A vector of charactors that contains labels for all lindividuals
- no.pc
A number of PCs to be calculated. If no.pc is set, PCs are patially calculated. Otherwise all PCs are obtained after calculation. Default = NA.
- data.type
To specify a type of data matrix X. It can be set to "linear" and "snp". Default = "linear".
Value
The returned value is a list with 4 objects, $PC,
$id, $label,and $status. Individuals with unknown status
are excluded.
$PCis a PC matrix which rows represent samples and columns represent PCs.$individual_idis a vector of charactors that contains individuals IDs.$labelis a vector of charactors that contains labels for all lindividuals.$statusis a vector of numbers that contains disease status for all. individuals.
See also
Examples
data(example_SNP)

#Create a random list of disease status, 1 = Control and 2 = Case

ind_status <- sample(c(1,2), size = length(sample_labels), replace = TRUE)

PCs <- cal.pc.projection(simsnp$snp, status = ind_status,
labels = sample_labels)
#> Warning: all eigenvalues are requested, eigen() is used instead
#> Warning: NaNs produced
summary(PCs)
#>        Length Class  Mode
#> PC     5459   -none- numeric
#> id        0   -none- NULL
#> label   103   -none- character
#> status  103   -none- character

#Preview $PC
print(PCs$PC[1:5,1:3])
#>            [,1]       [,2]        [,3]
#> [1,] -4.7379292 -15.876919   6.1944862
#> [2,]  0.0351340 -14.383381   4.6171056
#> [3,] -0.3201530  -9.902956  -0.9492197
#> [4,] -0.9223281 -12.515329   6.6789818
#> [5,] -2.8891995  -8.125934 -16.1552707

#Preview $status
print(PCs$status[1:3])
#> [1] "control" "control" "control"

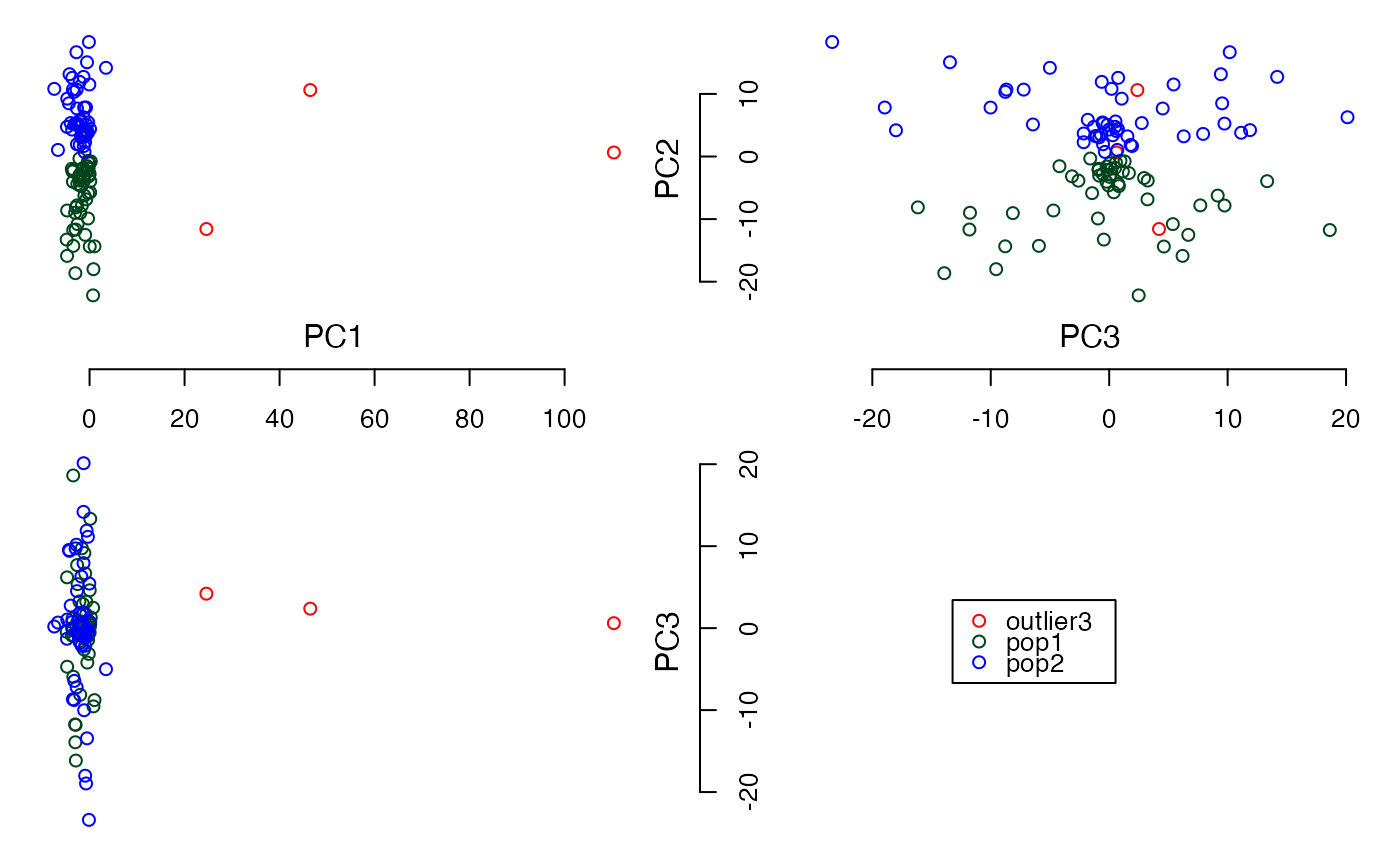
plot3views(PCs$PC[,1:3], PCs$label)


#Calculate the top 3 PCs

PCs <- cal.pc.projection(simsnp$snp, status = ind_status,
labels = sample_labels, no.pc = 3)
summary(PCs)
#>        Length Class  Mode
#> PC     309    -none- numeric
#> id       0    -none- NULL
#> label  103    -none- character
#> status 103    -none- character

#Preview $PC
print(PCs$PC[1:5,1:3])
#>            [,1]      [,2]       [,3]
#> [1,]  4.7379292 15.876919 -6.1944862
#> [2,] -0.0351340 14.383381 -4.6171056
#> [3,]  0.3201530  9.902956  0.9492197
#> [4,]  0.9223281 12.515329 -6.6789818
#> [5,]  2.8891995  8.125934 16.1552707

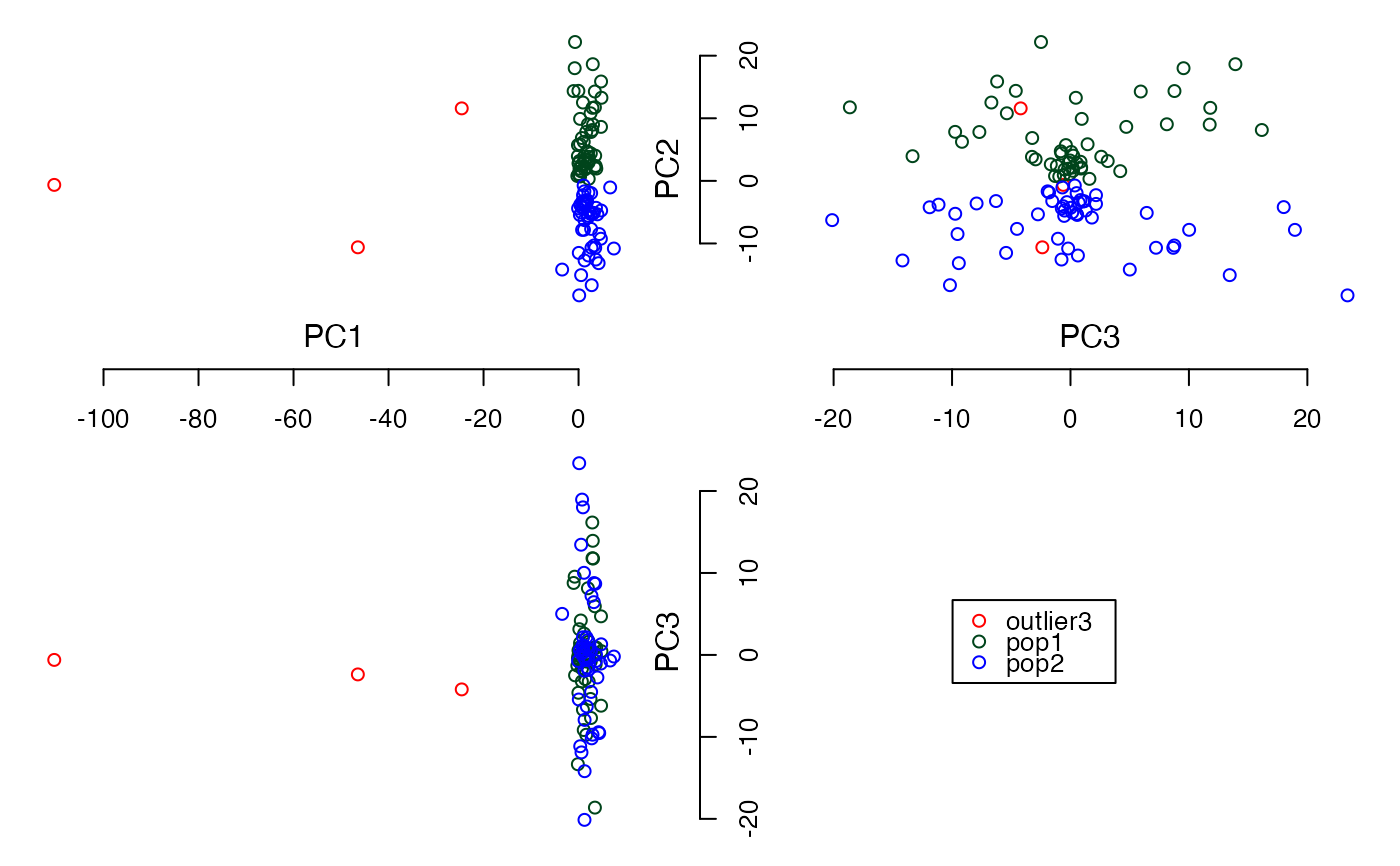
plot3views(PCs$PC[,1:3], PCs$label)
